
Foundry Is Not Tracing Your Agent, and Nothing Will Tell You
Foundry tracing is off until somebody connects Application Insights, and nothing tells you. Fix that in four clicks, then learn the OpenTelemetry GenAI model underneath it and the spans the platform will never write for you.
Microsoft Foundry observability is off by default. Four clicks turn it on, one RBAC grant makes it readable, and the OpenTelemetry GenAI conventions underneath it are portable knowledge rather than Azure trivia.
You shipped the agent, an analyst says the output 'went weird,' and the Traces page is empty. The instrumentation is fine.
In this article: You will learn why Foundry agent tracing stays silently off until an Application Insights resource is connected, how to connect it and grant the two roles that make traces readable, what an OpenTelemetry GenAI trace actually contains, the two competing ways to trace LangGraph and which one fits where, why trace data is Customer Data with a named owner, and the spans the platform will never write for you. By the end you will be able to tell the difference between a trace that documents a sequence and a trace that explains a decision.
An analyst opens a ticket. The weekly research brief for one covered company "went weird," citing a credit downgrade that appears in no filing anyone can find.
You have a conversation ID, a model, a governed toolbox, a memory store, a guardrail, and a router that picked one of several models for that run. The question is which of those produced the sentence. Without a trace, the honest answer is that you will guess, change one thing, and wait a week to find out whether the guess was right.
You open the Traces page in the Microsoft Foundry portal. It is empty. And you spend the rest of the afternoon debugging instrumentation that was never broken.
This article is about the four clicks that would have prevented that afternoon, and about the model underneath them: the OpenTelemetry GenAI semantic conventions that decide what a span is called and what it carries. It is also, unusually for this series, the part where neither framework track wins.
Tracing is off until somebody connects Application Insights
This is the single most repeated operational fact in the entire Foundry documentation set, and it produces the same failed afternoon every time.
The docs leave no room for interpretation: tracing is off by default, and no trace data is collected or stored unless it is explicitly enabled by a Foundry Account Owner or Foundry Owner. Enabling it means exactly one thing, and it is not a code change: connecting an Azure Monitor Application Insights resource to the project.
There is no separate tracing toggle. There is no SDK flag that turns on server-side collection. There is no warning banner on an agent that is running untraced. The telemetry has nowhere to go, and the platform does not consider that an error.
Gotcha: an empty Traces page means the connection is absent far more often than it means your instrumentation is broken. Check the connection before you check anything else.
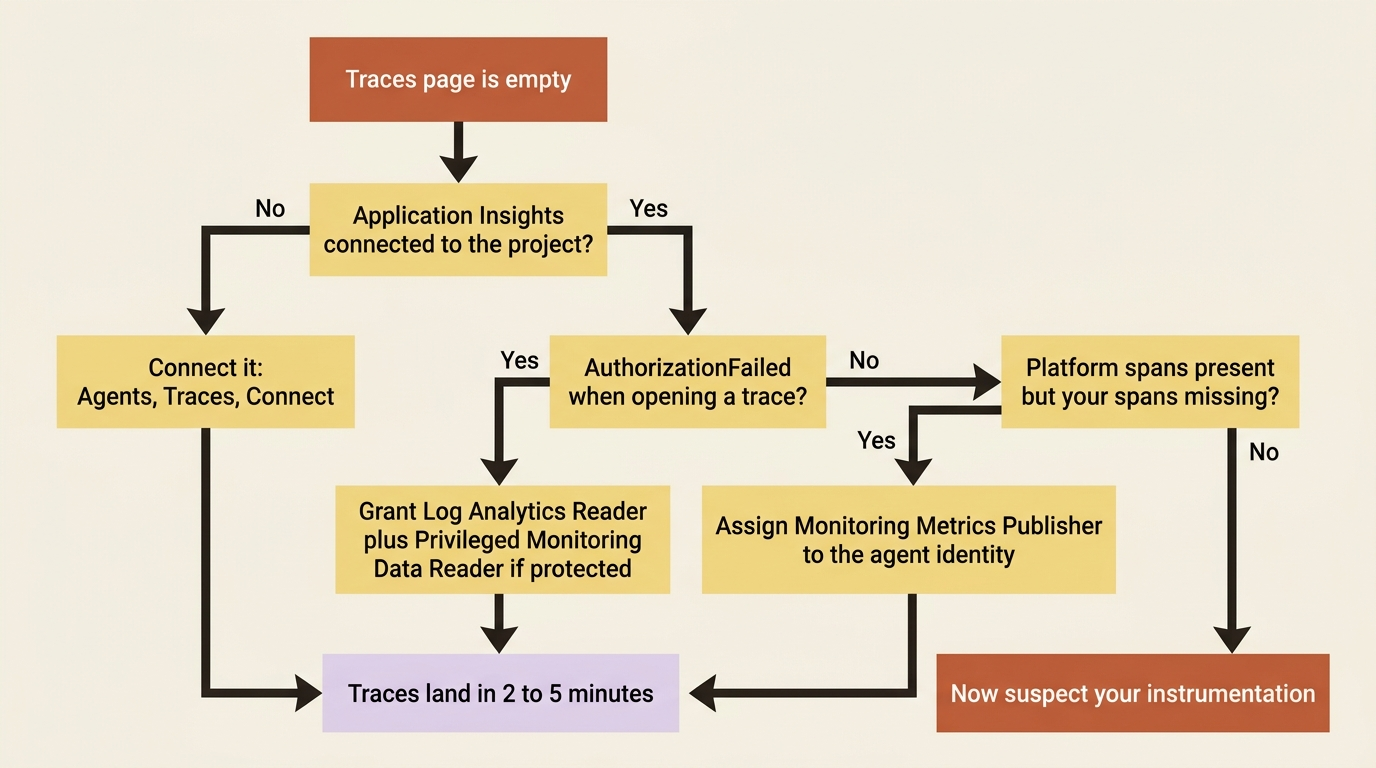
The connection path is short. In the Foundry portal, open the project, select Agents, select Traces at the top, and select Connect to create or attach an Application Insights resource. If the message bar or the Connect button is missing, take the other route: Manage, then Project details, then the Connected resources tab, then Add connection, then Application Insights. Both land in the same place.
The permission half, where the second failed afternoon lives
Connecting the resource lets traces in. Reading them is a separate grant.
You need the Log Analytics Reader role on the connected Application Insights resource to query telemetry, and if the underlying Log Analytics tables are configured as protected, you also need Privileged Monitoring Data Reader. An AuthorizationFailed error when opening a trace is an RBAC problem, not a tracing problem.
Verify deliberately rather than assuming. Confirm the project is connected, run the agent at least once, then open the Traces view and confirm a new trace appears with a timestamp, a duration, and a status. Traces typically land within two to five minutes of execution, and Application Insights itself takes 30 to 90 seconds to ingest spans. Refresh before you conclude anything.
Labels matter here, because they decide what you can promise a compliance reviewer. A note carried on the tracing pages states that tracing is generally available for prompt and hosted agents, and that workflow and external agents are in preview. The same pages also carry a blanket preview banner, and the hosted-agent tracing quickstart says flatly that tracing is currently in preview [CONTESTED: includes-trace-agent-preview.md against observability-quickstarts-quickstart-tracing-hosted-agent.md]. Read the specific statement as the useful one and the blanket banner as boilerplate. Entra-authenticated trace ingestion is separately preview [PERISHABLE: checked September 2026].
In production: for key-free ingestion, set the connection's Auth type to Project Managed Identity, which makes the portal assign Monitoring Metrics Publisher to the project managed identity. A hosted agent needs a second assignment, because its traces arrive from two identities: Foundry Agent Service emits server-side traces as the project managed identity, and your code inside the sandbox emits traces as the agent identity.
az role assignment create \
  --assignee-object-id "$AGENT_IDENTITY_OBJECT_ID" \
  --assignee-principal-type ServicePrincipal \
  --role "Monitoring Metrics Publisher" \
  --scope "$APP_INSIGHTS_RESOURCE_ID"
Miss that second assignment and you get half a trace: platform spans present, your own spans silently absent. Half a trace is worse than no trace, because a trace that shows the model call and not your validator looks complete.
What a trace actually contains
Foundry does not invent a telemetry format. It emits OpenTelemetry GenAI semantic conventions, which means the span names and attribute keys you learn here are portable knowledge rather than Azure trivia.
Three nouns carry the whole model. A trace is the journey of one request through your application. A span is one operation inside that trace, with a start time, an end time, attributes, and a parent, which is what lets spans nest into a call tree. Attributes are the key-value pairs hanging off a span. Semantic conventions are the shared agreement about what those names mean.
At a high level, tracing captures user inputs and agent outputs, tool usage including calls and results, token consumption, and time signals such as duration and latency. The nesting is the part that earns its keep. An agent invokes a tool, which starts a process, which invokes another tool, and when the top-level answer is wrong the trace is what tells you which level introduced it.
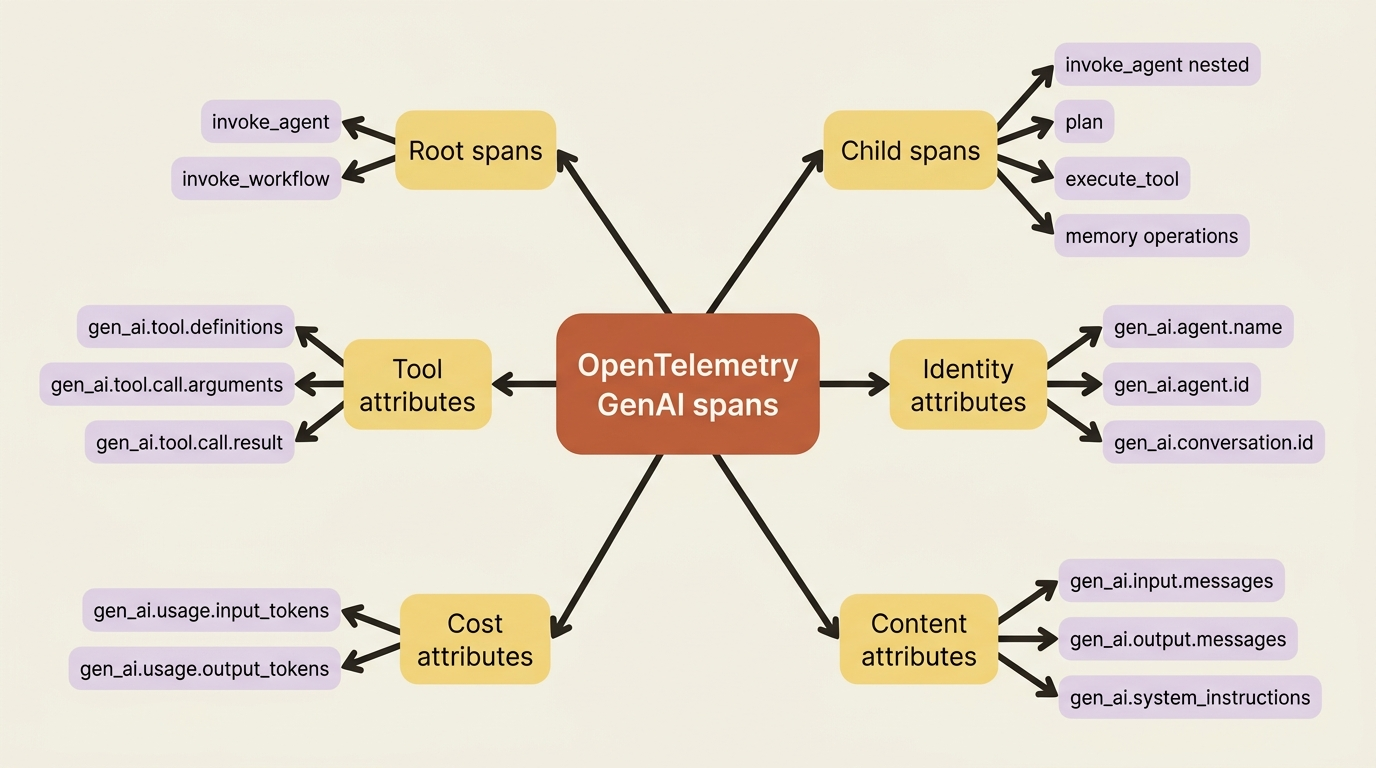
The span vocabulary is small enough to memorize, and Microsoft contributes multi-agent extensions to it in collaboration with Cisco Outshift:
| Kind | Typical parent | Name or attribute | What it records |
|---|---|---|---|
| Span | none | invoke_agent |
An agent invoked remotely or in process |
| Child span | invoke_agent |
invoke_agent |
One agent invoking another |
| Child span | invoke_agent |
plan |
A planning or task-decomposition phase |
| Span | none | invoke_workflow |
A coordinated workflow containing agents |
| Child span | invoke_agent or invoke_workflow |
execute_tool |
One tool execution |
| Child span | invoke_agent or invoke_workflow |
create_memory, search_memory, update_memory, upsert_memory, delete_memory |
A memory operation |
| Attribute | invoke_agent |
gen_ai.tool.definitions |
The tools available to the agent or model |
| Attribute | execute_tool |
gen_ai.tool.call.arguments |
What went into the tool |
| Attribute | execute_tool |
gen_ai.tool.call.result |
What came back |
The table covers the span kinds Foundry emits and the attributes that hang off them. Read it as a list:
invoke_agent: a root span for an agent invoked remotely or in process, and also a child span when one agent invokes another.plan: a child ofinvoke_agent, recording a planning or task-decomposition phase.invoke_workflow: a root span for a coordinated workflow that contains agents.execute_tool: a child ofinvoke_agentorinvoke_workflow, recording one tool execution.- Memory spans:
create_memory,search_memory,update_memory,upsert_memory, anddelete_memory, each a child ofinvoke_agentorinvoke_workflow. gen_ai.tool.definitions: an attribute oninvoke_agentlisting the tools available to the agent or model.gen_ai.tool.call.arguments: an attribute onexecute_toolholding what went into the tool.gen_ai.tool.call.result: an attribute onexecute_toolholding what came back.
Every boundary a governance review calls dangerous now has a span with a name, which is the difference between arguing about a design and querying it.
The attribute side carries the operational detail you will actually filter on: gen_ai.agent.name and gen_ai.agent.id, gen_ai.provider.name, gen_ai.request.model, gen_ai.conversation.id when a thread or session identifier is available, gen_ai.usage.input_tokens and gen_ai.usage.output_tokens, and gen_ai.input.messages and gen_ai.output.messages when content recording is on. Operation names map to span types through gen_ai.operation.name, with invoke_agent for an agent or chain step, chat for a model call, and execute_tool for both a tool call and a retriever.
One warning label comes from the conventions themselves, and it is not decoration: the OpenTelemetry GenAI semantic conventions have Development status and might change in future releases [PERISHABLE: checked September 2026]. Build dashboards on these attribute names by all means, and expect to revisit them.
Both tracks get traced, and this time that is the point
Start with the strongest version of the claim, because it is also the true one. Agents built with Microsoft Agent Framework or Semantic Kernel automatically emit traces when tracing is enabled for your project, with no additional code or packages required. Read that as the native path, and it is as good as it sounds.
Now the bring-your-own path on the same substrate. The hosted-agent protocol libraries, azure-ai-agentserver-responses and azure-ai-agentserver-invocations, integrate the Microsoft OpenTelemetry distro, which provides out-of-the-box instrumentation for Microsoft Agent Framework and LangChain, and exports to Application Insights. Foundry Agent Service emits server-side telemetry for agent invocation on top of that, with no code changes. The framework-tracing page adds OpenInference instrumentation packages as a third route and the OpenAI Agents SDK as a fourth. The observability overview names LangChain, LangGraph, the OpenAI Agents SDK, and Microsoft Agent Framework in one sentence.
For hosted agents, the correlation work is done for you as well. The server package configures the Azure Monitor export and enriches every span with project, agent name, agent version, and agent ID attributes so the portal can query and display them.
Pattern check: this is a non-seam, and the analysis has to say so. Elsewhere in this series, Toolbox, managed memory, and the model layer each name a place where Microsoft Agent Framework gets the tighter integration, and guardrails name one running the other way toward langchain-azure-ai. Observability runs neither way. Both tracks get server-side spans from the platform, both get client-side auto-instrumentation from the hosting library, both emit the same GenAI conventions into the same Application Insights resource, and both render in the same Trace Replay panel. A reader choosing a framework on observability grounds is optimizing a dimension that does not vary.
The one real asymmetry is smaller than a seam and worth a sentence. If you run Microsoft Agent Framework outside a Foundry hosted-agent server package, you configure the export yourself through the Microsoft OpenTelemetry distro, passing enable_azure_monitor=True and an agent-framework entry in instrumentation_options. The LangChain variant of that same call takes a langchain entry instead. Same function, same shape, one key different.
from microsoft.opentelemetry import use_microsoft_opentelemetry

use_microsoft_opentelemetry(
    enable_azure_monitor=True,  # ①
    sampling_ratio=1.0,  # ②
    instrumentation_options={
        "langchain": {  # ③
            "enabled": True,
            "agent_id": "research-desk",  # ④
            "agent_name": "Research desk",
        },
    },
)
① Turning on the Azure Monitor exporter is the whole point of the call. Spans go to whichever resource APPLICATIONINSIGHTS_CONNECTION_STRING names.
② A sampling ratio of 1.0 keeps every span. Lower it in production, because trace volume is what makes an Application Insights bill interesting.
③ The instrumentation key selects which framework gets auto-instrumented. This is the one key that differs: agent-framework here instead of langchain when you run Microsoft Agent Framework outside a hosted agent.
④ agent_id and agent_name stamp gen_ai.agent.id and gen_ai.agent.name onto every span, which is what the portal filters and groups on.
Note: The full extracted listing at code/azure-foundry-hyperscaler/part-13-observability-opentelemetry-and-trace-replay/listings/01-microsoft-opentelemetry-langchain.py shows the connection-string setup elided here.
The LangChain tracer, and the two paths that never mention each other
There is a second mechanism, and the documentation for it never acknowledges the first.
AzureAIOpenTelemetryTracer, imported from langchain_azure_ai.callbacks.tracers, is a callback handler. It emits spans for agent execution, model calls, tool execution, and retrieval, and attaches to any runnable through with_config. Install it with pip install -U "langchain-azure-ai[opentelemetry]" azure-identity.
from azure.identity import DefaultAzureCredential
from langchain_azure_ai.callbacks.tracers import AzureAIOpenTelemetryTracer

tracer = AzureAIOpenTelemetryTracer(
    project_endpoint=os.environ["FOUNDRY_PROJECT_ENDPOINT"],  # ①
    credential=DefaultAzureCredential(),  # ②
    name="research-desk",
    agent_id="research-desk",  # ③
    trace_all_langgraph_nodes=True,  # ④
)

graph = workflow.compile(checkpointer=checkpointer).with_config(
    {"callbacks": [tracer]}  # ⑤
)
① The project endpoint is the only connection detail the tracer needs. It reads the Application Insights connection string from the project itself.
② The credential authenticates that lookup, which is why no key and no connection string appear in the code.
③ agent_id sets gen_ai.agent.id on the spans, and the Control Plane custom-agent registration wizard later asks for the same value.
④ Tracing every LangGraph node is what turns one graph-shaped span into a per-step tree. Without it the trajectory is a single opaque row.
⑤ The tracer attaches as a callback on the compiled graph, so every invocation is traced rather than only the calls you remember to pass it to.
Note: The full extracted listing at code/azure-foundry-hyperscaler/part-13-observability-opentelemetry-and-trace-replay/listings/02-langgraph-azure-tracer.py shows the imports and graph construction elided here.
[CONTESTED: observability-how-to-trace-agent-framework.md against how-to-develop-langchain-traces.md] The framework-tracing page prescribes the microsoft-opentelemetry distro for LangChain and LangGraph and never names AzureAIOpenTelemetryTracer. The langchain-azure-ai tracing page prescribes AzureAIOpenTelemetryTracer and never names the distro. Both pages are current, and neither presents itself as an alternative.
The resolution is situational rather than a coin flip.
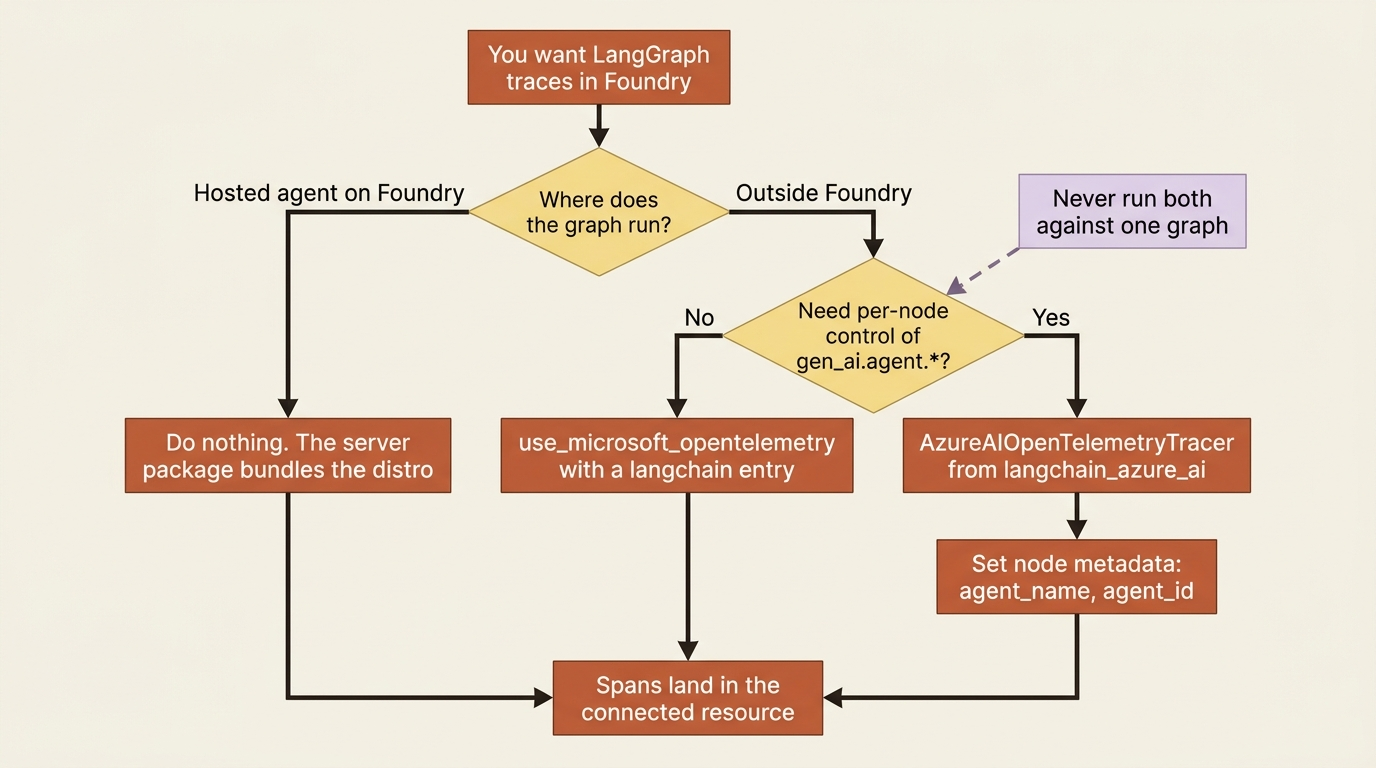
For a hosted agent you need neither, because the hosting library already bundles the distro. For a graph running outside Foundry, the distro is the lower-effort path, because it auto-instruments globally from one call. The tracer is the right choice when you want per-node control over gen_ai.agent.* attributes, or when you plan to register the deployment as a Control Plane custom agent, because the registration wizard asks for the agent_id you configured on the tracer. Do not run both against the same graph and expect one clean tree.
Gotcha: the environment variable for the Application Insights connection string is spelled two ways in the documentation. APPLICATIONINSIGHTS_CONNECTION_STRING, the Azure Monitor standard and the name Foundry injects into every hosted-agent container, appears in ten files. APPLICATION_INSIGHTS_CONNECTION_STRING, with the extra underscore, appears in two, including the tracer page and the OpenAI Agents SDK sample [CONTESTED: agents-how-to-configure-hosted-agent-telemetry.md against how-to-develop-langchain-traces.md]. Set the platform spelling, and when you use the tracer, pass connection_string explicitly rather than betting an afternoon on which one the constructor reads.
Name your nodes, or read four identical rows
A multi-agent LangGraph trace is unreadable when every span is named after the graph instead of the step.
The tracer resolves gen_ai.agent.name from the first non-empty value in a documented order: agent_name in the node metadata, then langgraph_node set automatically by LangGraph, then agent_type, then the name keyword from the LangChain callback, then the last element of langgraph_path, then the serialized chain ID or class name, and finally the name constructor parameter as the fallback. A graph whose nodes carry no metadata falls a long way down that ladder, and every span inherits one generic label.
The fix is node metadata, set once in the graph definition, at three lines per node:
workflow.add_node(
    "screen_filings",
    screen_filings,
    metadata={
        "agent_name": "FilingScreener",
        "agent_id": "desk-filing-screener",
        "otel_agent_span": True,
    },
)
Any metadata key beginning with gen_ai. is forwarded as a span attribute, and otel_trace: True or otel_trace: False includes or skips individual nodes when you do not want everything traced. Name your nodes for the reviewer who opens the trace six weeks from now, not for the function that happens to implement them.
Traces contain your customers' prompts
Microsoft's own page calls trace data Customer Data. The framing turns content recording from a debugging convenience into a data-handling decision with a named owner.
Foundry tracing "captures Customer Data from AI agents," and the recorded information includes user inputs and prompts, agent and model inputs and outputs, tool calls and intermediate steps, and execution metadata. Anyone holding Log Analytics Reader on the connected resource can read it, which may include personal data and customer content. Your responsibilities are named on that page too: informing end users what is collected and who can see it, meeting your privacy and regulatory obligations, and configuring access controls and retention.
Seven OpenTelemetry attributes are classified as sensitive content: gen_ai.input.messages, gen_ai.output.messages, gen_ai.system_instructions, gen_ai.tool.definitions, gen_ai.tool.call.arguments, gen_ai.tool.call.result, and gen_ai.evaluation.explanation. Foundry can route those seven to a dedicated AppGenAIContent table that you protect with RBAC, so the rest of your trace telemetry stays readable by the team while the content stays behind a privileged role.
az feature register --namespace Microsoft.Insights --name protectGenAISensitiveData
Registering that flag routes sensitive content only to AppGenAIContent. Set that table's protection level to Protected, then grant Privileged Monitoring Data Reader to the identities that genuinely need to read prompts, and leave everyone else on standard read roles where they are denied by default.
A migration schedule is attached, and it is the kind that breaks things quietly.
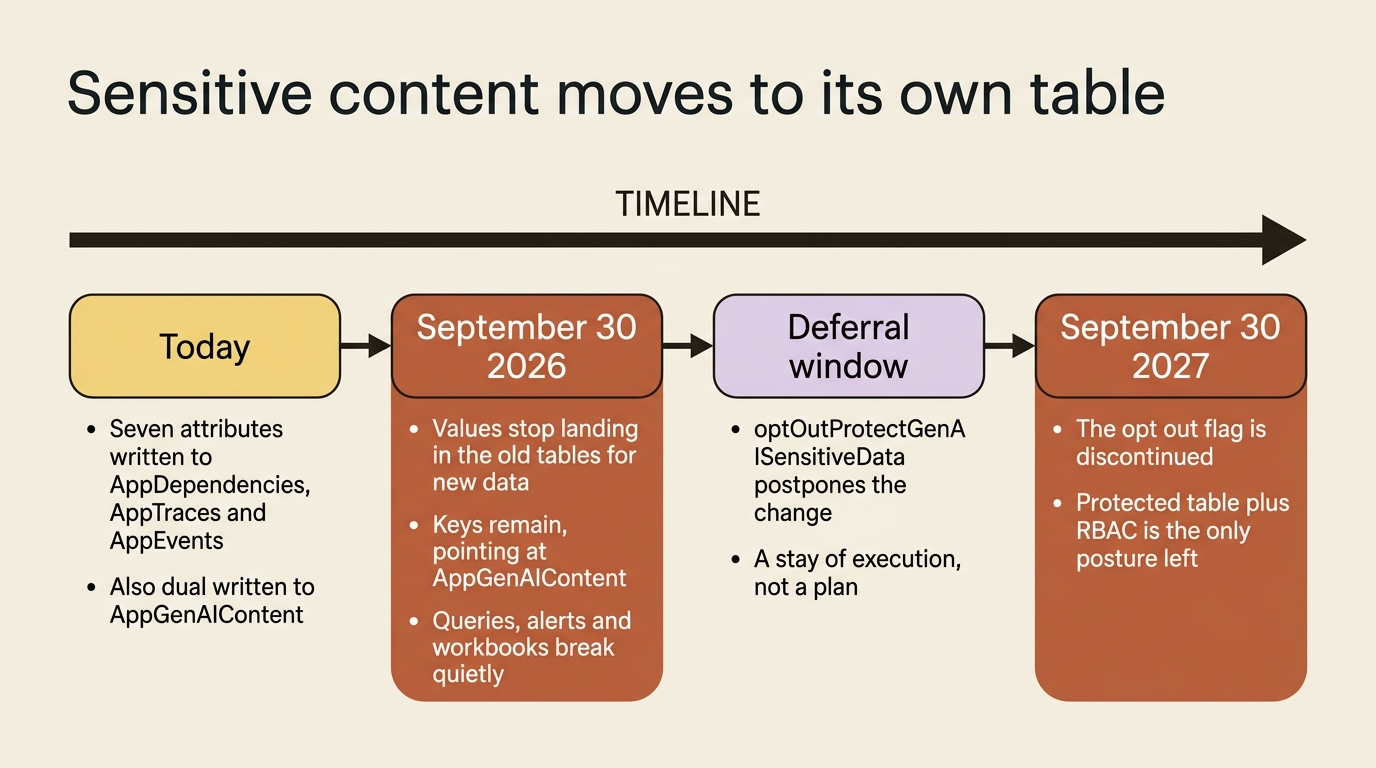
Before September 30, 2026, the seven attributes are written to both the existing tables and AppGenAIContent. From that date, the values stop landing in AppDependencies, AppTraces, and AppEvents for newly ingested data, with the keys left behind pointing at the new table. A temporary optOutProtectGenAISensitiveData flag defers the change and is discontinued on September 30, 2027 [PERISHABLE: dates printed as of September 2026]. Custom queries, alert rules, workbooks, and dashboards that read those values are the things that break.
Two defaults that disagree with each other
Separate from where content is stored is the question of whether it is captured at all. The documentation contradicts itself here.
The Foundry SDK path is explicit and cautious: content recording captures user messages, tool call arguments, and model outputs, and the docs carry a caution to enable it only in development, and not in production unless your compliance requirements allow it. You opt in by setting OTEL_INSTRUMENTATION_GENAI_CAPTURE_MESSAGE_CONTENT to true.
The langchain-azure-ai tracer runs the opposite default: "content recording is enabled by default," and you pass enable_content_recording=False to redact message content and tool call arguments [CONTESTED: how-to-develop-langchain-traces.md against observability-how-to-trace-agent-client-side.md].
Gotcha: read those two defaults together before you ship. A team that adopts the LangChain tracer after reading the SDK page's caution will assume content recording is off and will be wrong. Set the flag explicitly in both directions, in code, per environment, and treat an unset flag as a bug rather than a default.
One more exemption surprises people who think they have turned content off. The OTEL_INSTRUMENTATION_GENAI_CAPTURE_MESSAGE_CONTENT variable controls built-in traces only. The @trace_function decorator always records parameters and return values regardless of that setting. A decorated function that takes an archive excerpt as an argument writes that excerpt into telemetry with content recording nominally off.
Retention and cost follow Application Insights rather than Foundry. Trace data lives in the connected resource, retention and billing follow your Application Insights and Log Analytics configuration, and the docs point at sampling rates and retention periods as the two knobs for production cost. Traces from the Foundry portal cover the past 90 days.
Sending telemetry somewhere that is not Azure
A hosted agent's export destination is environment variables on the agent version, which makes it a deployment decision rather than a runtime one.
Hosted agents generate telemetry from two places: the protocol runtime, meaning the Responses or Invocations server, and your own code. The protocol libraries bundle the OpenTelemetry distro, so both emit without any telemetry setup in your code. The runtime picks its exporters by looking at environment variables at startup. When the platform-injected APPLICATIONINSIGHTS_CONNECTION_STRING is present it exports to Application Insights. When OTEL_EXPORTER_OTLP_ENDPOINT is present it also exports over OTLP. Both at once is supported and is the normal case.
environment_variables:
  - name: OTEL_EXPORTER_OTLP_ENDPOINT
    value: https://<your-provider-otlp-endpoint>     # not secret
  - name: OTEL_EXPORTER_OTLP_PROTOCOL
    value: http/protobuf
  - name: OTEL_EXPORTER_OTLP_HEADERS
    value: ${{connections.otel-secrets.credentials.otlp_headers}}
The header is usually a secret, so it goes in a Custom keys project connection and gets referenced by placeholder, resolved when the sandbox starts. Create the connection before you deploy the version, because a missing connection resolves the placeholder to an empty value rather than failing loudly.
Four operational details from that page save real time:
- Environment variables are set per version and immutable once the version is created, so changing an export destination means a new agent version.
APPLICATIONINSIGHTS_CONNECTION_STRINGis platform-reserved and cannot be set or overridden inagent.yaml, so the only way to stop sending to Application Insights is to disable monitoring at the project level.service.nameis fixed to the agent's name and shows up ascloud_RoleName, andOTEL_SERVICE_NAMEhas no effect because the platform overrides it. If you want a different service name, you rename the agent.- Standard OpenTelemetry environment variables such as
OTEL_TRACES_SAMPLERwork for tuning, with the note that sampling affects spans only and log records export regardless.
In production: exporting to a non-Microsoft observability provider sends telemetry that can include prompt, tool, and response content to that provider, under their handling, retention, and location policies. A team that chose a data-zone deployment for residency reasons and then pointed OTLP at a US-hosted vendor has moved the prompts out of the boundary through the observability stack, which is exactly the door nobody audits.
For the non-telemetry half of operations there is azd. azd ai agent monitor fetches recent console logs from the agent's last invoke session, --follow streams, --type system shows container lifecycle events for crash loops, and --session-id filters to one session. The log-pattern table on that page is the fastest triage sheet in the docs: Listening on 0.0.0.0:8088 means the agent started; AuthenticationError means the agent's Entra agent identity cannot authenticate, so check RBAC; ModelNotFound is a deployment-name mismatch; ResourceNotFound is a wrong FOUNDRY_PROJECT_ENDPOINT; and container restart events in the system log mean a crash loop.
Logs answer "did it start." Traces answer "what did it do."
The spans the platform will never write for you
Tracing has an honest boundary.
A Foundry trace shows you that the model was called, what it was asked, what came back, which tool ran, what it returned, and how many tokens and milliseconds each step cost. It does not show you that your validator rejected the first draft, that your scoring threshold discarded four of six retrieved filings, that your stopping rule cut the loop after three iterations, or that your own code decided a covered company's downgrade did not cross this analyst's threshold.
Those are the decisions a reviewer actually asks about, and they live in your code.
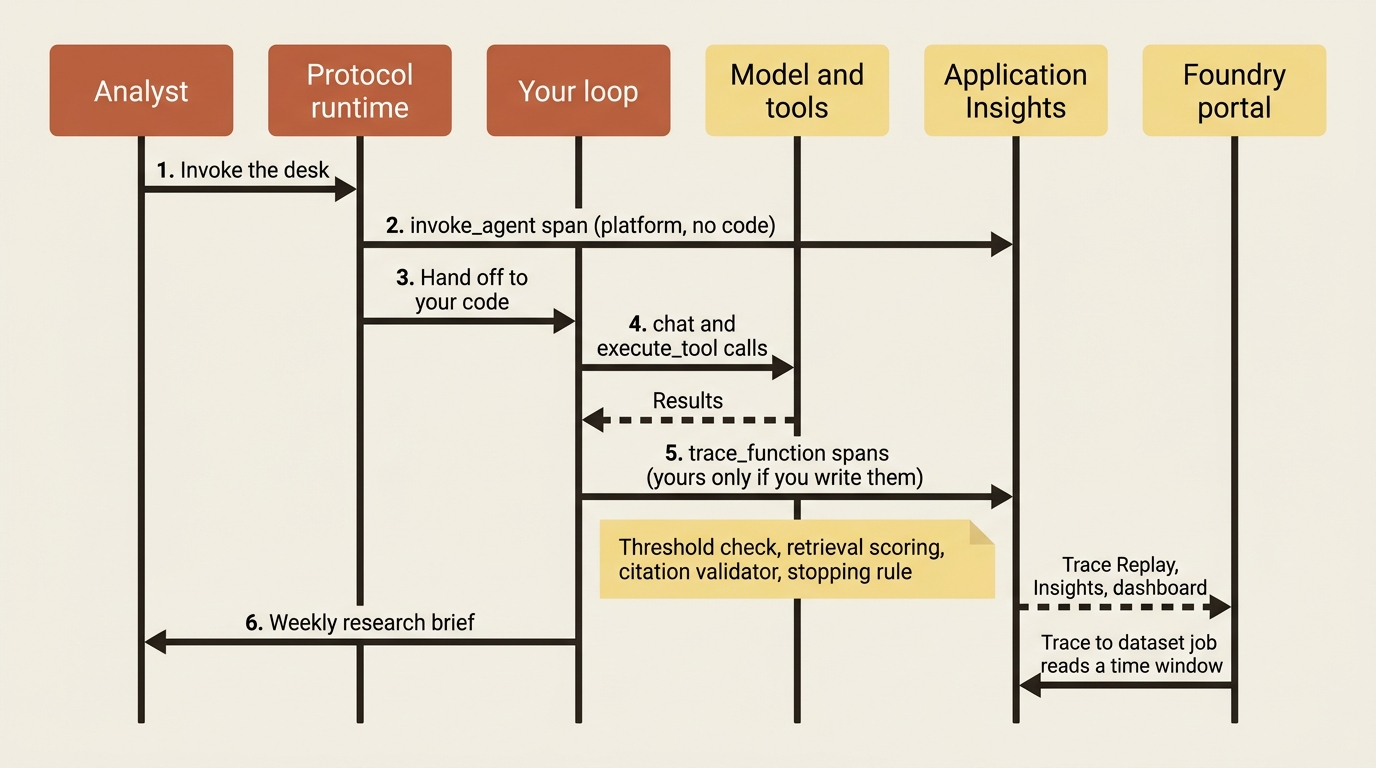
The Foundry SDK gives you a decorator for exactly this. trace_function from azure.ai.projects.telemetry creates a span per call, records parameters as code.function.parameter.<name> and the return value as code.function.return.value, and takes an optional custom span name:
from azure.ai.projects.telemetry import trace_function

@trace_function("threshold-check")
def crosses_analyst_threshold(analyst_id: str, severity: int) -> bool:
    """Decide whether a finding is worth surfacing to this analyst."""
    return severity >= THRESHOLDS[analyst_id]
Supported attribute types are str, int, float, bool, and collections; object types are omitted. In .NET there is no decorator, and the documented pattern is a plain ActivitySource registered alongside Azure.AI.Projects.* in your tracer provider.
In production: platform spans turn a trace into a receipt. Your spans turn it into a diagnosis. The test is simple: open a trace of a run that went wrong and ask whether it explains the decision or only the sequence. If it only explains the sequence, the missing spans are the ones you own.
One concrete failure mode is worth installing against today. Trace-based evaluation reads only spans where gen_ai.operation.name equals invoke_agent, and quality evaluators pull the query and response from gen_ai.input.messages and gen_ai.output.messages on those spans. An agent that does not emit those attributes produces evaluators that return score=None, which looks like a broken evaluator and is actually a missing attribute. For Python agents built on the agent server SDK, the documented fix is an extra:
pip install "azure-ai-agentserver-core[tracing]"
Install it now rather than during the week you are trying to ship an evaluation gate.
Reading a trace: Replay, annotations, and the aggregate views
Trace Replay (preview) reconstructs an agent conversation for inspection, and it opens from any page that references a Conversation ID or Trace ID.
It offers two views of the same trace. The Trajectories view renders a hierarchical span tree with a waterfall bar per span that you can measure by either duration or token cost, which is how you find the step that is slow and the separate step that is expensive. The User view presents the same trace as a chat, reflecting what the end user experienced, with a collapsible span tree alongside. Selecting any span shows the step in the agent loop, its raw metadata as JSON, and the results of any evaluations that ran on that conversation.
Filtering is what makes a long trace usable. Span-type filters cover Chat, Agent, Tool, and Conversation; a Find in trace box searches by span name; and a token filter buckets spans as Low (under 500 tokens), Medium (500 to 2k), and High (over 2k) for finding outliers. The Playthrough control replays the conversation sequentially at 1x, 2x, or 4x, with a scrubber, and it requires at least two spans, so single-span traces cannot be replayed.
Human judgment attaches to traces directly. Trace annotations (preview) let a reviewer put a thumbs up or thumbs down plus free text on a trace from the portal, tagged with source builder, while your application can log end-user feedback programmatically as the gen_ai.evaluation.result OpenTelemetry event with source end_user. Every project is preseeded with a default thumbs template scoring 1.0/pass and 0.0/fail against the evaluation name task_completion, so you can annotate on day one. Annotations are appended, never overwritten, and they are queryable:
customEvents
| where name == "gen_ai.evaluation.result"  // ①
| extend
    score = todouble(customDimensions["gen_ai.evaluation.score.value"]),  // ②
    eval_source = tostring(customDimensions["microsoft.gen_ai.human_evaluation.source"]),  // ③
    explanation = tostring(customDimensions["gen_ai.evaluation.explanation"])
| where score == 0.0  // ④
| project timestamp, eval_source, explanation
| order by timestamp desc
① Both annotation paths land in customEvents under the same OpenTelemetry event name, whether a reviewer clicked thumbs down in the portal or your application logged end-user feedback.
② The score arrives as a dynamic value inside customDimensions, so it needs an explicit cast before a numeric comparison works.
③ The human-evaluation source separates builder annotations from end_user feedback. Those two are worth reading apart, not averaging together.
④ Filtering to 0.0 selects the failures, which is the review queue rather than a metric.
Note: The full extracted listing at code/azure-foundry-hyperscaler/part-13-observability-opentelemetry-and-trace-replay/listings/03-annotation-failures.kql shows the time-window filter elided here.
Two aggregate views sit above individual traces. The Agent Monitoring Dashboard (preview) on an agent's Monitor tab tracks token usage, latency, run success rate, evaluation metrics, and red-teaming results for the selected time range. The docs offer blunt thresholds worth arguing with rather than adopting: latency above 10 seconds suggests throttling, complex tool calls, or network issues, and a run success rate below 95 percent warrants investigation.
Insights (preview) goes further and analyzes traces for recurring behavior, grouping them into reviewable items with a category, a severity, linked and highlighted traces, a likely cause, and a proposed action. The categories are Context and memory, Cost and tokens, Hallucinations, Latency, Output quality, Reliability errors, Security and risk, and Tool call failures. The first analysis uses a seven-day lookback, and you pick the judge model it runs on.
Insights earns one caveat that the page states itself: it can analyze only the evidence available in traces, and missing identity, content, spans, tool arguments, or tool results reduce the quality of its grouping and diagnosis. An agent with content recording off and no custom spans gets shallow insights, which is the price of the privacy posture and worth deciding deliberately rather than discovering.
Traces become the evaluation set
Production traces are the most representative source of how your agent behaves, and Foundry will turn a time window of them into a versioned dataset.
Trace-based dataset generation (preview) takes an agent and a date range and produces a dataset registered in your project. What makes it more than an export is intelligent sampling, which is on by default: it filters out low-intent traffic such as single-character messages, selects a diverse representative sample using MinHash so the result covers the range of scenarios rather than overindexing on frequent near-identical prompts, and handles sensitive content. The argument for it is economic. Evaluations cost money per row, most raw traces carry little signal, and a curated set produces better signal at lower cost than evaluating everything.
The job is one nested object: what the dataset is for, where the rows come from, and how many of them to keep. The source block is the only part that makes it a trace read rather than a file upload.
job = DataGenerationJob(
    inputs=DataGenerationJobInputs(
        name="desk-eval-set",
        scenario=DataGenerationJobScenario.EVALUATION,  # ①
        sources=[
            TracesDataGenerationJobSource(  # ②
                description="Application Insights conversation traces for the desk.",
                agent_name="research-desk",  # ③
                start_time=start_time,
                end_time=end_time,  # ④
                # agent_version="4",   # pin to a specific version (recommended)  ⑤
            ),
        ],
        options=TracesDataGenerationJobOptions(max_samples=100),  # ⑥
        output_options=DataGenerationJobOutputOptions(name="desk-eval-set"),
    ),
)
poller = project_client.beta.datasets.begin_create_generation_job(job=job)  # ⑦
① The scenario tells the service the dataset is for evaluation, which is what selects the standard query-response schema the evaluation APIs read.
② The source type is what makes this a trace read. The service queries Application Insights on your behalf, using the project's managed identity.
③ Scoping to one agent name keeps other agents sharing the same Application Insights resource out of the set.
④ The time window is the sampling frame, and it is the input the intelligent sampler selects a diverse subset from.
⑤ Pinning the agent version is the recommended setting. A window that spans a deployment mixes two agents into one measurement.
⑥ max_samples must sit between 15 and 1000. Sampling picks a representative subset rather than the first hundred rows it finds.
⑦ The job runs in the background, so the call hands back a poller instead of a finished dataset.
Note: The full extracted listing at code/azure-foundry-hyperscaler/part-13-observability-opentelemetry-and-trace-replay/listings/04-traces-to-dataset.py shows the imports, client construction, and time window elided here.
Two prerequisites bite in practice: the Python SDK floor is azure-ai-projects>=2.4.0, and the project's managed identity needs Log Analytics Reader on the connected Application Insights resource, because the service queries traces on your behalf rather than as you.
Pin agent_version. A dataset that mixes traces from three agent versions measures your release history rather than your agent.
Do this today
- Check the connection before anything else. Open your project, select Agents, then Traces. If there is a Connect button, tracing has never been on, and every run you have shipped so far went unobserved.
- Grant both roles, and both identities. Log Analytics Reader for the humans who read traces, Monitoring Metrics Publisher for the agent identity so the spans from inside the sandbox arrive alongside the platform's. Half a trace looks complete and is not.
- Decide the content posture before the first trace lands. Register
protectGenAISensitiveData, setAppGenAIContentto Protected, give Privileged Monitoring Data Reader to the two people who investigate incidents, and set content recording explicitly in code rather than inheriting two contradictory defaults. - Name your graph nodes. Three lines of metadata per node turn a Trajectories waterfall of identical rows into something a non-engineer could follow.
- Wrap the four places your loop makes a judgment. The threshold check, the retrieval scoring pass, the output validator, and the stopping rule. Those four are exactly what the "it went weird" ticket is asking about.
- Then generate a dataset. One job, seven days,
agent_versionpinned,max_samplesat 100. It is built from what your agent actually did rather than from what you imagined it would do.
The cheapest lock-in in the platform
Foundry takes over collection, correlation, storage, and presentation. Server-side spans for prompt and hosted agents with no code changes, auto-instrumentation for Microsoft Agent Framework, Semantic Kernel, LangChain, LangGraph, and the OpenAI Agents SDK, automatic enrichment of every span so the portal can attribute it, a 90-day trace store you did not provision, a replay panel with a waterfall and a scrubber, a sensitive-content table with its own RBAC boundary, and an analysis pass that reads a week of production traffic and proposes what to look at. Building the presentation layer alone is a quarter of engineering time at most companies, and it is the part nobody budgets for.
What stays yours is the judgment layer. The connection itself, because the platform will not make it for you and will not tell you it is missing. The spans around your own decisions, because platform spans document the sequence and not the reasoning. The node names, because a trace where every span carries the same label is a trace nobody reads twice. The content-recording posture, which is a data-handling decision with a named owner and two disagreeing defaults in the documentation. The retention and sampling configuration, because tracing an agent is the fastest way to make a logging bill interesting. And the interpretation, because a dashboard that says latency is 11 seconds has told you a number, not a cause.
The exit question comes out better here than anywhere else on the platform. Trace data is OpenTelemetry, in the GenAI semantic conventions, in Application Insights, which is Azure Monitor, which speaks OTLP in both directions. You can export hosted-agent telemetry to any OTLP-compliant backend by setting two environment variables, run it alongside Application Insights or instead of it, and keep your span names and attribute keys unchanged because they were never Foundry's names to begin with. What does not travel is the presentation: Trace Replay, the Insights categories, the annotation surface, and the trace-to-dataset job are Foundry experiences over standard data. Losing them costs you tooling, not history.
Your agent can now be watched. What it cannot yet be is graded. A trace tells you the brief cited four filings; it does not tell you whether those citations support the claim. Grading is a different problem, and it needs a judge.
But none of it starts until somebody clicks Connect.